Abstract: The study of art, especially perspective, involves the use of specialized vocabulary words which can be difficult to learn. Metacognitive reflection (MR) offers a method to improve student learning of academic language. Teacher feedback on students’ reflections provides additional benefits. This quasi-experimental study measured the influence of MR and teacher feedback on students’ ability to learn and retain academic language. This study was conducted three separate times, to improve validity. While the MR treatment groups attained and maintained greater mean gains overall, post-hoc tests revealed that differences between groups in two of three studies were not statistically significant. The groups who engaged in reflection with feedback added a weighted mean gain of d = .37 to their posttest score beyond that of the comparison groups. This finding provides moderate evidence for the efficacy of practicing reflection with feedback.
Keywords: metacognition, academic language, reflection, teacher feedback, visual arts
摘要(Eric E. Howe: 元认知反射对艺术专业的学生有利吗?): 对艺术的学习,尤其是对视角的研究,包含可能难以学习的一些专业汇词的使用。元认知反射(MR)提供了一种改善学生学习术语的方法。老师对学生思考的反馈提供了附加的好处。 这项准实验研究测量了MR和老师反馈对学生学习和保留术语能力的影响。这项研究涉及了三个不同的时间,以提高有效性。虽然MR治疗组总体上获得并保持了更大的平均收益,但事后的测试显示,三项研究中的两项在各组之间的差异上不具备统计学意义。参与反馈的小组在测试后的评分中增加了d = 0.37的加权平均收益,这超过了其他小组。 这一发现为使用反馈进行反思的有效性提供了适度的证据。
关键词:元认知,术语,反思,教师反馈,视觉艺术
摘要(Eric E. Howe: 元認知反射對藝術專業的學生有利嗎?): 對藝術的學習,尤其是對視角的研究,包含可能難以學習的一些專業匯詞的使用。元認知反射(MR)提供了一種改善學生學習術語的方法。老師對學生思考的反饋提供了附加的好處。這項準實驗研究測量了MR和老師反饋對學生學習和保留術語能力的影響。這項研究涉及了三個不同的時間,以提高有效性。雖然MR治療組總體上獲得併保持了更大的平均收益,但事後的測試顯示,三項研究中的兩項在各組之間的差異上不具備統計學意義。參與反饋的小組在測試後的評分中增加了d = 0.37的加權平均收益,這超過了其他小組。這一發現為使用反饋進行反思的有效性提供了適度的證據。
關鍵詞:元認知,術語,反思,教師反饋,視覺藝術
Zusammenfassung (Eric E. Howe: Nutzt die metakognitive Reflexion den KunststudentInnen?): Ein Studium der Kunst, insbesondere der Perspektive, beinhaltet die Verwendung von Fachwörtern, die schwer zu erlernen sein können. Metacognitive Reflexion (MR) bietet eine Methode zur Verbesserung des Lernens von Studierenden in der akademischen Sprache. Das Feedback der Lehrkräfte zu den Reflexionen der Schüler bietet zusätzlichen Nutzen. Diese quasi-experimentelle Studie misst den Einfluss von MR und Lehrer-Feedback auf die Fähigkeit der Schüler, akademische Sprache zu erlernen und zu bewahren. Diese Studie wurde dreimal durchgeführt, um die Validität zu verbessern. Während die MR-Handlungsgruppen insgesamt höhere mittlere Zuwächse erzielten und aufrechterhielten, zeigten Post-Hoc-Tests, dass die Unterschiede zwischen den Gruppen in zwei von drei Studien statistisch nicht signifikant waren. Die Gruppen, die sich mit Feedback an der Reflexion beteiligten, fügten ihrer Posttestbewertung einen gewichteten mittleren Gewinn von d = .37 hinzu, der über den der Vergleichsgruppen hinausging. Dieser Befund liefert moderate Belege für die Wirksamkeit der Praxis der Reflexion mit Feedback.
Schlüsselwörter: Metakognition, akademische Sprache, Reflexion, LehrerInnen-Feedback, visuelle Kunst
Аннотация (Эрик Э. Хове: Насколько важна для студентов художественных направлений подготовки метакогнитивная рефлексия?) Изучение искусства, особенно того участка, где особенно важно разбираться в перспективизации, сопряжено с вводом специальной лексики, освоение которой дается студентам нелегко. Метакогнитивная рефлексия является методом, который способствует улучшению процесса обучения студентовнаучной терминологии. Дополнительный эффект возникает за счет того, что сами преподаватели наслаивают свою рефлексию на рефлексию студентов. За счет такого, почти экспериментального варианта, «замеряется» влияние метакогнитивной рефлексии и «профессиональной» эвалюации на способность студентов усваивать и запоминать научный язык. Такие замеры проводились трижды, чтобы сделать результаты более валидными. Если в группах, в которых внимание было сфокусировано на метакогнитивной рефлексии, обозначился рост средних показателей, то апостериорные тесты в двух из трех случаев не выявили существенных различий. Группы, в которых был задан ориентир на обратную связь, продемонстрировали в плане оценки значительный средний прирост d=.37; этот показатель оказался выше, чем в сопоставляемых группах. Полученные данные позволяют сделать выводы об эффективности использования методов метакогнитивной рефлексии и обратной связи для решения конкретных учебных задач.
Ключевые слова: метакогниция, научный язык, рефлексия, обратная связь со стороны педагогов, визуальное искусство
Introduction
The study of art, especially perspective, involves the use of specialized vocabulary words (Montague, 2013). Students in art do not always enjoy or respond well when asked to learn the more formal parts of the curriculum (Pennisi, 2013). This includes vocabulary words, which can be difficult to comprehend (Jucks & Paus, 2012), because they convey context specific concepts (Uccelli, Galloway, Barr, Meneses, & Dobbs, 2015). When students have learned to use the specialized vocabulary or academic language of a subject, communication between teacher and student improves (Lahey, 2017).
Knowing academic language also helps the learner think about the content (Nagy, Townsend, Lesaux, & Schmitt, 2012). While academic language is only a part of a visual art curriculum (National Coalition for Core Arts Standards, 2014), students need support from the teacher to learn it (Lahey, 2017). Metacognitive reflection (MR) offers a method to increase student learning of academic language, and other subjects in general (Bond, Denton, & Ellis, 2015; Jucks & Paus, 2012).
Significance
Oddly, while reflection was almost universally called for in art education theory, few empirical studies have examined the efficacy of this technique when applied to the art classroom. A Boolean search of five leading peer reviewed art education journals revealed 21 articles that included the words “reflective” and “assessment” in the title, or body of the text. Of these, only a handful addressed students reflecting on their work in the manner Bond, Denton, and Ellis (2015) studied. None of these studies reported statistical information that could be further examined. Even the rich collection of case studies on reflective practice by Burnard and Hennessy (2006) while inspiring, did not provide statistical data to help the reader gauge the size of the impact of the described experiences.
Theoretical Constructs
Metacognition
Among the many theoreticians who have contributed to the study of metacognition, three stood out as foundational: Piaget, James, and Vygotsky (Fox & Riconscente, 2008). Building on the work of these foundational theoreticians, John Flavell and Ann Brown developed the theory of metacognition through research on children’s use of learning strategies. Brown (1994) expressed metacognition as the process through which learners “have insight into their own strengths and weaknesses and access to their own repertoires of strategies for learning” (p.9).
After Brown’s untimely death in 1999, Flavell continued to research metacognition extensively (e.g. Flavell, 1979; Flavell, 1985; Flavell, 1999; Flavell, 2000; Flavell, Green, & Flavell, 2000; Wellman, Ritter, & Flavell, 1975). Flavell differentiated among metacognitive knowledge, experiences, goals, and actions (Flavell, 1979).
Metacognitive Reflection
One metacognitive action that was developed over time and used by students to attain learning goals was MR. Metacognitive reflection was defined as thinking about learning or “critical revisiting of the learning process in the sense of noting important points of the procedures followed, acknowledging mistakes made on the way, identifying relationships and tracing connections between initial understanding and learning outcome” (Georghiades, 2004a, p. 371).
Though beneficial, students did not always engage in metacognitive thinking (Wismath, Orr, & Good, 2014), even when provided with a variety of well-designed prompts and activities (Kwon & Jonassen, 2011). A conducive classroom environment was necessary for students to engage in meaningful reflection (Black, & Wiliam, 2009). Students must have trusted the teacher (Georghiades, 2004a) and been free from fear of judgment from other students or the instructor (Slinger-Friedman & Patterson, 2016).
Even with ideal conditions, students needed the guidance of a teacher as they engaged in reflection. Learners’ perceptions of their use of metacognition was often inaccurate (McCardle & Hadwin, 2015). They may have felt they were regularly reflecting in deep ways on their learning, while their reflections were relatively shallow and infrequent. Additionally, there was potential for students to be misled by their reflections. When students found a subject easy to learn and conflated this with thinking they would be able to easily remember the subject in the future, they may not have devoted enough effort to review (Proust, 2007). Finally, students must have applied the results of their reflection to future learning in order to complete the process and this was not guaranteed to happen (Tarricone, 2011).
To mitigate these pitfalls, teachers could model MR for their students (Ellis, Denton, & Bond, 2014). Zimmerman (2013) explained that when a student carefully watched a skilled person such as a teacher or more advanced student perform a task and subsequently observed positive benefits as a result of correct task completion, the student could become highly motivated to continue with their own learning. Additionally, when a person modeled self-correction this helped the observing student in the future when they encountered similar situations (Zimmerman, 2013). Think Aloud was an example of one such strategy where a teacher talked through their thinking as they solved problems in front of students (Ellis et al., 2014).
Though many teachers seemed to understand the benefits of MR they did little to promote it (Dignath & Büttner, 2018). If the educator did not intentionally plan time for reflective habits to be cultivated, the other parts of the curriculum squeezed this out (Zuckerman, 2003). Fortunately, MR activities could be simple enough for teachers to easily implement in the face of competing priorities (Bannister-Tyrrell & Clary, 2017).
Teacher Feedback
While teacher feedback seemed to be a common feature of many classrooms, it was often misapplied by well-meaning teachers when they praised a student without addressing the task (Hattie & Timperley, 2007). When done well, feedback helped the learner understand where to head next in their learning (Hattie & Clarke, 2019). This gave the learner direction and motivation to continue. In a recent meta-analysis, Hattie & Clarke (2019) reported feedback as having an effect of d = 0.73 on student achievement.
Feedback could also prevent faulty models from being adopted. Students who did not know they misunderstood a concept might not have realized they had misunderstood until they were presented with information that challenged their understanding. Presenting students with feedback on their correct and incorrect answers was one way to help them sort out which areas they had learned and still needed to learn (Kwon & Jonassen, 2011).
Reflection in Art
Reflection had long been a part of art education. As early as 1992, Winner and Simmons writing for Harvard’s Arts PROPEL project asked art teachers to encourage art students to reflect on their work. Standards published by the National Coalition for Core Arts Standards (2018) called on students to respond to artwork by analyzing, interpreting, and evaluating artwork.
Many state and local school districts also advocated for students to reflect on their work. For instance, the Maryland State Department of Education (2018) published a standard titled Use of Student Self-Reflection in Assessment Tasks. Included on their Fine Arts Education website was ashort form for students to use to reflect on their work. Another example was the San Diego Unified School District’s (2018) Self-Reflection Assessments. As noted earlier, while reflection was almost universally called for in art education theory, few empirical studies had examined the efficacy of reflection when applied to the art classroom, providing impetus for the current study.
Academic Language
The current study included teaching academic language related to perspective drawing. Academic language skill was increasingly recognized as critical to student learning (Lawrence, Corosson, Paré-Blagoev, & Snow, 2015; Uccelli et al., 2015). Academic language could be difficult to comprehend (Jucks & Paus, 2012), because it conveyed context specific concepts (Uccelli et al., 2015). When students had learned to use the academic language of a subject, communication between teacher and student improved (Lahey, 2017). Knowing academic language also helped the learner think about the content (Nagy et al., 2012).
Metacognitive reflection was one method that could support student learning (Bond et al., 2015). During reflection a learner might have wondered if they really comprehended a word, realize they didn’t and asked the teacher for help, or looked it up in a dictionary, and subsequently arrived at a more accurate understanding (Jucks & Paus, 2012). Beyond simply reciting a definition, students used these words to convey context specific concepts (Uccelli et al., 2015). Meaningful learning included practicing the language (Uccelli et al., 2015) in various ways, including discussion (Lawrence et al., 2015). While this approach privileged formal language, thoughtful teachers took care not to devalue the language skills learners brought to the classroom from their communities (MacSwan, 2018).
Review of Empirical Studies of Metacognition
The following studies provided evidence of the effectiveness of MR in improving learning outcomes. The findings of these studies, methods used, and authors’ reflections on the efficacy of the methods and results informed the design and execution of the current study.
Metacognition and Math Journals
Baliram and Ellis (2019) conducted a study in a high school geometry classroom. Five intact classes were randomly assigned to a treatment or comparison condition. A pretest was administered to help control for preexisting group differences. This was followed by an intervention consisting of MR, posttest, and retention test. The test was developed and published by a textbook company.
This study was informed by Hattie’s (2012) work and included a teacher feedback component. Other researchers (e.g. Bianchi, 2007) have pointed out the possible differential effect of teachers reacting to student reflections. If one group benefited from improved instruction based on their expressed needs and another did not, this could have confounded interpretation of results. In order to prevent this, a third party, in this case one of the researchers, read the student responses and provided feedback. While this may have avoided biased responses from the teacher to individual students, the teacher was aware of general trends in feedback and did act on these. Therefore, this method may have only partially controlled for the differential effect noted earlier.
The author acknowledged that intact classes may have impacted results. For example, the sample of 75 participants was slightly below the number indicated by a power analysis. Nevertheless, the results did achieve statistical significance with the treatment group outscoring the comparison group on the posttest (F (1, 73) = 7.27, p = .009, = .09) (Baliram & Ellis, 2019). Though there were limitations, this study was thoughtfully conducted and was representative of what could be realistically done in educational settings (Gall et al., 2007).
Metacognition, Academic Achievement, and Intelligence
Ohtani and Hisasaka (2018) conducted a meta-analysis of 118 articles that reported correlations between metacognition and academic achievement and included a measure of intelligence. After combining the effect sizes of the articles, Ohtani and Hisasaka (2018) reported a moderate correlation between metacognition and academic achievement when controlling for intelligence (r = .28, 95 % CI [0.24, 0.31], p < .001). They concluded that intelligence was a confounding variable. Individuals with higher intelligence tended to process information rapidly, which might have freed up extra mental capacity for metacognition (Ohtani & Hisasaka, 2018).
A limitation of this study was the authors’ choice to exclude students and adults with disabilities. During the 2015-16 school year, 13% of all students age 3-21 enrolled in U.S. public schools received special education services (McFarland et al., 2018). Excluding students with disabilities meant a significant segment of the population was not included in the study.
Metacognition and Confidence
Weight (2017) studied 171 elementary and secondary teachers and support staff. In this correlational study, staff members who used metacognitive instructional strategies reported greater confidence in their ability to work with students who experienced anxiety (χ2 (1, N = 171) = 20.93, p < .05) on a self-report, Likert-type survey (Weight, 2017).
The sample of surveyed teachers was large and representative of both primary and secondary teachers with equal distribution of a wide range of years of experience.
In addition to the survey, a small group of teachers were also interviewed to gather qualitative insights on their use of metacognitive strategies and the extent to which these strategies increased their confidence in working with students who experienced anxiety.
As the author noted, surveys were limited by the honesty of the participants (Weight, 2017). Even when respondents were presumably as forthright as possible, there was a known lack of fit between teacher report of metacognitive promotion and actual practice (Dignath & Büttner, 2018) which calls for caution when reading the results of the self-report measure.
Dissertation Synthesis
Bond, Denton, & Ellis (2015) examined the impact on student learning as a result of reflective self-assessment as documented in 10 doctoral dissertations. These dissertations reported results from a broad array of classes including math, science, world languages, English Language arts, social studies and geography. In each study, students were asked to participate in reflective activities towards the end of the period. Teacher feedback was a part of the intervention in six of the studies. A positive effect size using Cohen’s d was documented for posttest scores in seven of the studies, while three studies showed a negative effect size. The resulting weighted mean effect size was 0.28 for the posttest, with a range of -0.34 to 0.69 (Bond et al., 2015).
Bond et al. (2015) clearly defined their methodology including the criteria for inclusion of studies, information about each study, and how effect sizes were calculated and combined. A limitation of this synthesis was that all studies were conducted at one institution, generally representing the public schools of one geographical area, with an exception. To strengthen these findings studies including students from other types of schools and locations could be added.
Learning Science
Georghiades (2004b) conducted an experiment with students in Year Five. The average age of these students was 11. After placing 60 students evenly into two groups, one group received metacognitive instruction as part of the regular classroom activities, the other group did not. With this exception both groups received the same instruction on concepts in the Current Electricity unit. Scores from the previous year’s science exam and a general thinking ability exam were included in the analysis to ensure a valid comparison between groups could be made. Following four 80-minute lessons, both groups were assessed three times on their understanding of scientific concepts related to the lessons. The same assessment was used each time. The test was given a week, two months, and eight months after the unit concluded. The groups were initially close in mean scores, however over time the experimental group retained more information as evidenced on the final administration of the exam (p = .048) (Georghiades, 2004b).
The statistical test used in this study provided a reason for readers to interpret the results with caution. The researcher relied on three t-tests to analyze the data. The use of multiple t-tests inflated the chance of Type I error (Field, 2013). A more conservative approach would have been to use ANOVA with Bonferroni adjustment (Tabachnick & Fidell, 2007). Additionally, the researcher adjusted instruction based on reading student diaries. Other researchers (e.g. Bianchi, 2007) have pointed out the possible differential effect of teachers reacting to student reflections. Although aspects might have been improved, it was the type of situated inquiry that relied on methods beyond student self-report and was needed to add to our knowledge of the effects of metacognition (Dinsmore et al., 2008).
Method
Research Questions
The current study was guided by the following questions:
- To what extent does MR influence students’ ability to learn and retain academic language related to perspective drawing?
- To what extent does teacher feedback to the MR influence students’ initial ability to learn and retain academic language related to perspective drawing?
Research Design
The research design used in this study was quasi-experimental, conducted with intact classes taught by the investigator (see Table 1).
Table 1: Quasi-Experimental Design
| Group | Pretest | Intervention | Posttest | Retention Test |
|---|---|---|---|---|
| Reflection with Feedback | O | X1 | O | O |
| Reflection | O | X2 | O | O |
| Comparison | O | O | O |
The sample was a convenience sample consisting of students enrolled in the investigator’s semester length middle school visual arts classes. To overcome the reduced internal validity of intact groups, three iterations of the study: Spring 2018, Autumn 2018, and Winter 2019, were conducted with different groups over several terms. Because there was a wide range of ages and abilities represented in each class, students with prior art knowledge might have performed better on the assessments due to their prior knowledge and not due to their assigned condition, or for other reasons not addressed by the study. The pretest was an attempt to mitigate this threat to internal validity (Gall et al., 2007).
Participants and Sampling Process
Demographics
The students sampled were enrolled in the investigator’s middle school visual arts class. This school was located in a city in King County, Washington State, and was part of a K-12 public school district that served approximately 17,000 students. The middle school in which the studies were conducted served approximately 800 students in grades six through eight. Of these students, 51.4% were female while 48.6% were male. The school records indicated .5% of students enrolled were American Indian/Alaskan Native, 8.1% Asian, 10 % Black/African American, 26.6 % Hispanic/Latino of any race(s), 5.2% Native Hawaiian/Pacific Islander, 40% White, and 9.2% Two or More Races. Approximately 14.8% of these students were English Language Learners, 12.5% received special education support, and 59.4% of the students qualified for free or reduced lunch. The school had an Unexcused Absence Rate of 1.81%.
Assignment of Condition
To remain objective, the investigator flipped a coin to decide which condition each class would receive. The assignment of condition took place before the unit commenced. The first coin flip determined MR intervention or comparison. For classes assigned to the MR condition, the second flip assigned reflective assessment with or without teacher feedback.
Sample Size
To ensure the number of participants in each study was large enough for the statistical test to detect an effect if it existed (Gall et al., 2007), an a priori power analysis was conducted using G*Power 3 (Faul, Erdfelder, Lang, & Buchner, 2007). This program calculated required sample size based on investigator determined power level, significance level, and the population effect size expected to be found at a set probability. For this analysis the population effect size was set to 0.3 (Ellis, 2010). Output from the analysis indicated a total sample size of 75 required with (p < .05) and a power level of .8 (Lakens, 2013).
Description of Samples
Five art sections were included in each study. Students ranged in age from 11-15. The demographics of each class largely mirrored the overall school demographics with one exception, noted in the limitations section. A majority of students enrolled in Art One were in sixth grade and a majority of Art Two students were in seventh or eighth grade. The classes averaged 25 students, of whom 20.6 participated in the study, on average. Students in these classes had widely varying levels of past art instruction and skill. A small percentage of students reported receiving regular art instruction in elementary school, while many received sporadic, or none.
In the first study conducted in Spring 2018, three classes were assigned to reflective assessment (see Table 2).
Table 2: Spring 2018 Sample
| Condition | Section | Class Period | N |
| Comparison | Art 1 | 2 | 21 |
| Reflection with Feedback | Art 1 | 3 | 17 |
| Reflection with Feedback | Art 2 | 4 | 21 |
| Comparison | Art 2 | 5 | 22 |
| Reflection only | Art 1 | 6 | 21 |
In the second study conducted in Autumn 2018, three classes were assigned to reflective assessment (see Table 3).
Table 3: Autumn 2018 Sample
| Condition | Section | Class Period | N |
| Reflection with Feedback | Art 1 | 2 | 21 |
| Reflection only | Art 2 | 3 | 23 |
| Comparison | Art 2 | 4 | 18 |
| Reflection with Feedback | Art 2 | 5 | 16 |
| Comparison | Art 1 | 6 | 16 |
In the third study conducted in Winter 2019 three classes were assigned to reflective assessment (see Table 4).
Table 4: Winter 2019 Sample
| Condition | Section | Class Period | N |
| Comparison | Art 1 | 2 | 22 |
| Reflection only | Art 2 | 3 | 21 |
| Comparison | Art 2 | 4 | 23 |
| Reflection only | Art 2 | 5 | 21 |
| Reflection with Feedback | Art 1 | 6 | 25 |
Protection of participants
This study involved typical classroom instruction and assessment procedures, which did not require informed consent from participants. The investigator protected the privacy of participants’ data by only reporting scores that could not be linked to individual students. Additionally, raw data was kept in secure locations and destroyed at appropriate intervals as prescribed by Washington State Administrative Code. Participating in this study posed no risks to students.
Measures
The first study relied on a teacher generated thirty-question multiple choice test of academic language related to perspective drawing. This test was developed by the investigator in the role of classroom teacher as part of the regular curriculum. While Gall et al. (2007) noted the limitations of teacher generated tests, after searching, no suitable standardized measure of the academic language relating to perspective was located. Thus, additional measures were undertaken to ensure the test was appropriate for use in research.
Construct validity was assessed by comparison to similar measures in published art curricula and inclusion of academic language listed in state and national visual art standards. Content validity was attained through a review by a group of art teachers teaching similar ages. The test was examined for reliability by generating split-half reliabilities using posttest scores. A value above .7 indicated that an instrument was consistently measuring the same factor (Vogt & Johnson, 2011). Spearman’s rho correlations between the halves of the Spring 2018 test administration were .81 indicating a reliable measure.
Following the Spring 2018 test administration, a potential ceiling effect was noted in the results. This effect was indicated by score distributions on the posttest with negative skewness (see Table 5) (Ho & Yu, 2015). A ceiling effect might have prevented proper data analysis (French, Sycamore, McGlashan, Blanchard, & Holmes, 2018). To reduce this effect, the investigator added an additional six questions of greater difficulty bringing the total to 36. The same measures to assure validity and reliability used with the original version were conducted on the revised test. Spearman’s rho correlations between the split-halves of the Autumn and Winter test administration were .80 and .71 respectively, indicating a reliable measure.
Table 5: Tests of Normality Spring 2018
| N | Skewness | Kurtosis | |||
| Statistic | Statistic | Std. Error | Statistic | Std. Error | |
| Pretest | 102 | 0.077 | 0.239 | 0.971 | 0.474 |
| Posttest | 102 | -0.635 | 0.239 | -0.239 | 0.474 |
| Retention Test | 102 | -0.999 | 0.239 | 1.667 | 0.474 |
Procedure
For each iteration, at the beginning of the ten-day perspective unit, a pretest on academic language related to perspective drawing was administered to all classes on day one. Students in all conditions were then instructed over the course of the following eight, 56-minute class periods using a variety of methods including teacher modeling, note-taking, guided practice, independent practice and group discussion. At the end of the unit on day ten, following a review, all groups completed the same questions as a posttest. Three weeks after the posttest, the same exam was administered as a retention test.
The investigator, in the role of classroom teacher, used the same instructional methods with all classes, varying only the way class ended. The classes assigned to the comparison group did not complete reflective assessments, but instead spent the final five minutes of class on instructional days in guided or independent practice. For the classes assigned to reflective assessment, students engaged in a four to five-minute reflective activity. These took place on instructional days, toward the end of class, for a total of nine reflective sessions. During these sessions, students were asked to complete a short reflective assessment of the day’s learning such as an I Learned statement, a Key Idea Identification, or a Clear and Unclear Windows (Ellis, & Denton, 2010). The MR prompt used was varied from day to day, so students would not lose interest (Georghiades, 2004b).
Reflection only classes did not receive feedback on their reflective assessments apart from the investigator in the role of classroom teacher thanking them for completing it.
In the reflection with feedback condition, the investigator in the role of classroom teacher individually responded to each student’s reflection with a short note or verbal comment related to what they wrote as soon as possible (Slinger-Friedman & Patterson, 2016). Because exact timing of the delivery of the feedback was controversial (Shute, 2008), some delayed feedback was also provided. When an obvious theme in student responses emerged, the investigator in the role of classroom teacher communicated this to the entire class (Hattie & Clarke, 2019), often as a way of introducing the following day’s lesson.
Students in any class who were absent for the pretest were offered a chance at the beginning of the following class session to complete the assessment before instruction began. Students who were absent, or unable to complete the pretest during this time were not included in the study. These students’ attendance in class during the lessons and then subsequent completion of the pretest would have skewed the results. Students who missed significant class time, in this case three or more lessons out of the ten-day unit, were also dropped from the study. The limitations section includes more information on these dropped students.
Statistical Analysis
Because ANOVA had a lower chance of Type I error than multiple t-tests (Field, 2013) and allowed post-hoc testing with a Bonferroni adjustment (Tabachnick & Fidell, 2007), a repeated measures ANOVA was used in this study. Mean scores and standard deviations for each group at each test time were calculated. Data was then checked for the usual assumptions of the general linear model including skewness and kurtosis (Vogt & Johnson, 2011). To conduct this test, scores of skewness and kurtosis were converted to z-scores by dividing by their standard error and comparing their absolute value to 1.96. Scores greater than 1.96 were statistically significant at the (p < .05) level (Field, 2013).
To conduct the repeated measures ANOVA, student scores on the academic language test were entered into SPSS Version 25 software. Mauchly’s test was used to see if the assumption of sphericity was violated, if so the Greenhouse-Geisser values were interpreted (Field, 2013). Any missing scores on post or retention test were replaced with a mean substitution.
A repeated measures ANOVA was used to analyze scores based on whether they came from a group engaged in MR or not, and presence or absence of teacher feedback on the students’ reflections. As such, there was one within subjects factor: time of test, with three levels: pretest, posttest, and retention test. There was one between subject factor: group, with three levels: reflection with feedback, reflection only, and comparison. The level of statistical significance for this analysis was set at (p < .05).
A post-hoc test with a Bonferroni adjustment post-hoc test was conducted. Post-hoc comparisons allowed the investigator to determine the direction and magnitude of differences based on group (Field, 2013). A Bonferroni adjustment was used to reduce chances of a Type I error or detecting an effect when there was not one (Tabachnick & Fidell, 2007).
In addition to tests of statistical significance the investigator calculated effect sizes pretest to posttest and pretest to retention test for each study using Cohen’s d. An effect size provided a way to express the practical significance of a study (Ellis, 2010). Pretest to posttest comparisons showed which group had higher initial gains while, pretest to retention test comparisons showed which group better retained these gains (Little, 1960).
Effects by condition were also combined to compare overall results. Borenstein, Hedges, Higgins, and Rothstein (2009) proposed using a fixed-effect model to calculate mean weighted effect sizes if two conditions were met: studies were very similar, and the object was to calculate effect sizes for the population represented in the studies only, not to generalize to other groups. The current study satisfied these conditions. The method used in this study to calculate weighted mean effect size involved multiplying each studies’ effect size by the sample size of that study, adding these together and then dividing by the combined sample size of all three studies (Ellis, 2010).
Results
Spring 2018
In the Spring 2018 study, all groups made gains between each test (see Figure 1), except for the reflection with feedback group which plateaued between post and retention test.
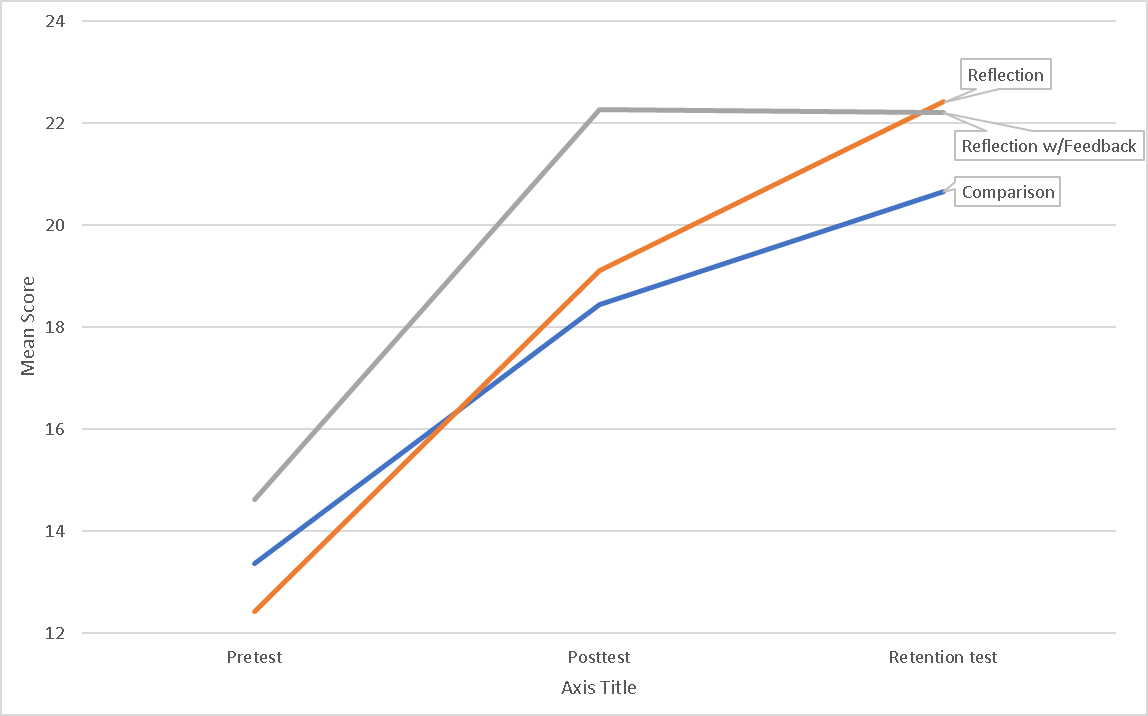
Figure 1: Mean Score by Condition Spring 2018
There was statistically significant: positive kurtosis in the pretest scores, negative skewness in the posttest, and both negative skewness and positive kurtosis in the retention test (see Table 5). The investigator concluded the non-normality was based on real data and not errors. Because non-normality could be offset by the sample size, and this study involved 102 subjects, the investigator proceeded with the repeated measures ANOVA (Field, 2013).
Mauchly’s test confirmed the assumption of Sphericity was not violated (p = .27). There was a statistically significant within-subject interaction effect between time of test and condition (F(4, 198) = 2.66, p =.03). However, a Bonferroni adjustment revealed group score differences were not statistically significant when compared across condition.
Autumn 2018
In the second study conducted in autumn 2018, all groups made gains between each test (see Figure 2). The reflection only group started with the highest pretest mean scores and maintained this lead for the following two assessments.
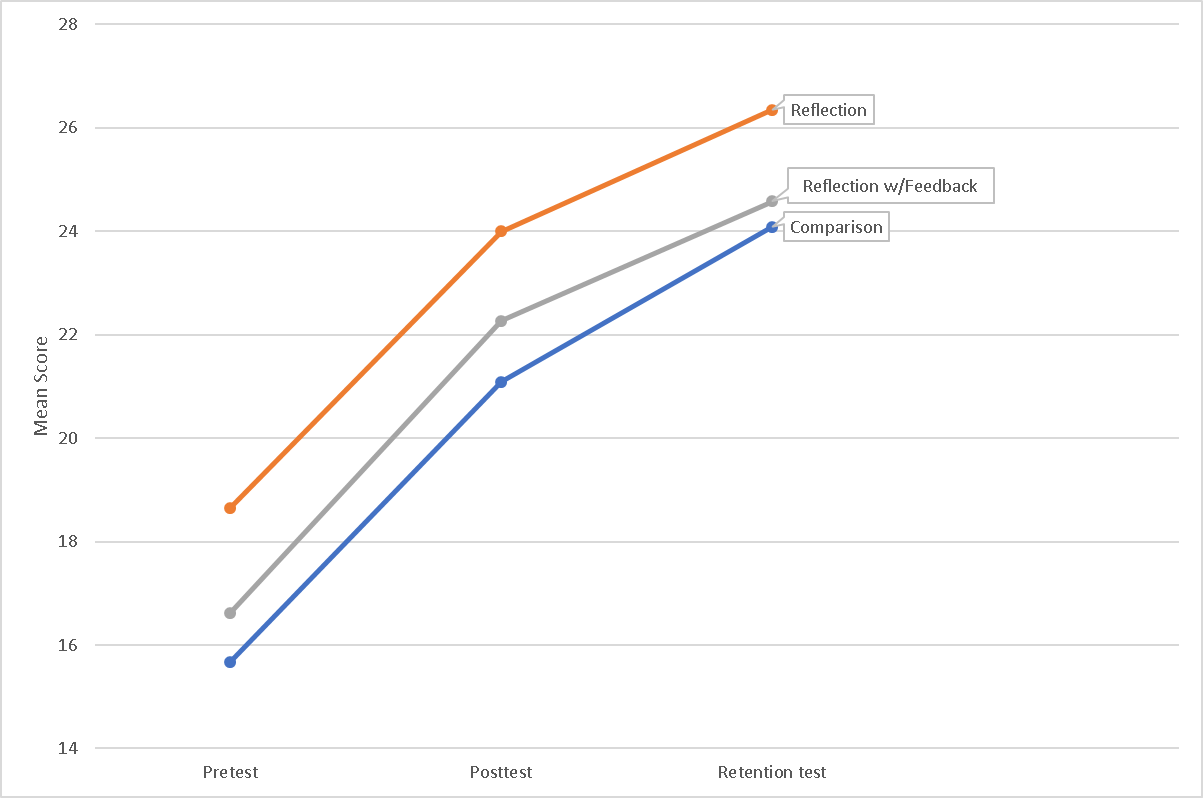
Figure 2: Mean Score by Condition Autumn 2018
There was statistically significant positive skewness and kurtosis in the pretest scores (see Table 6).
Table 6: Tests of Normality Autumn 2018
| N | Skewness | Kurtosis | |||
| Statistic | Statistic | Std. Error | Statistic | Std. Error | |
| Pretest | 94 | 0.702 | 0.249 | 1.12 | 0.493 |
| Posttest | 94 | -0.205 | 0.249 | -0.414 | 0.493 |
| Retention test | 94 | -0.233 | 0.249 | -0.641 | 0.493 |
While there was mild negative skewness and kurtosis in the post and retention tests a simple test confirmed these to be not statistically significant (Field, 2013). The investigator concluded the pretest non-normality was indicative of subjects having limited knowledge of test items prior to the unit and proceeded with statistical testing (Field, 2013).
Mauchly’s test revealed the assumption of Sphericity had been violated χ2(2) =13.96 (p < .001) so the Greenhouse-Geisser values were interpreted. Bonferroni adjustment revealed group score differences were not statistically significant when compared across condition.
Winter 2019
In the third study conducted in winter 2019, all groups made gains between each test, except for the reflection group which plateaued between posttest and retention test (see Figure 3).
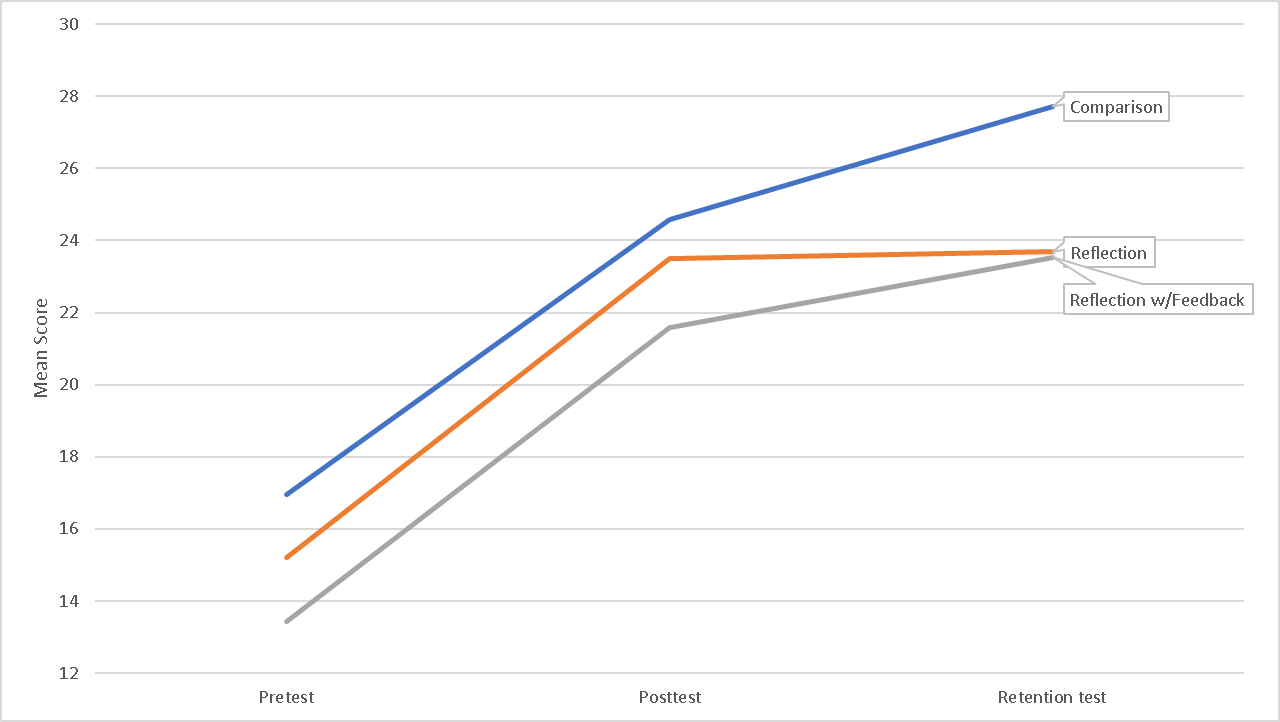
Figure 3: Mean Score by Condition Winter 2019
There was statistically significant positive skewness in the pretest scores (see Table 7).
Table 7: Tests of Normality Winter 2019
| N | Skewness | Kurtosis | |||
| Statistic | Statistic | Std. Error | Statistic | Std. Error | |
| Pretest | 112 | 0.456 | 0.228 | 0.872 | 0.453 |
| Posttest | 112 | -0.262 | 0.228 | -0.332 | 0.453 |
| Retention Test | 112 | -0.259 | 0.228 | -0.008 | 0.453 |
While there was mild skewness and kurtosis in the posttest and retention test a simple test confirmed these to be not statistically significant (Field, 2013). The investigator concluded the pretest non-normality was indicative of subjects having limited knowledge of test items prior to the unit and proceeded with statistical testing (Field, 2013).
Mauchly’s test confirmed the assumption of Sphericity was not violated (p = .30). There was a statistically significant between-subject effect based on condition (F(2, 109) = 7.21, p < .001). A Bonferroni adjustment revealed group score differences between the comparison group and the reflection group were statistically significant (p = .03). Score differences between the comparison group and the reflection with feedback group were also statistically significant (p = .002) (see Table 8).
Table 8: Post-Hoc Winter 2019
| Multiple Comparisons | ||||||
| Bonferroni Adjustment | ||||||
| 95% Confidence Interval | ||||||
| (I) Condition | (J) Condition | Mean Difference (I-J) | Std. Error | Sig. | Lower Bound | Upper Bound |
| Comparison | Reflection | 2.287* | 0.859 | .027 | 0.197 | 4.376 |
| Reflection with Feedback | 3.562* | 0.999 | .002 | 1.135 | 5.993 | |
| Reflection | Comparison | -2.287* | 0.859 | .027 | -4.376 | -.197 |
| Reflection with Feedback | 1.277 | 1.012 | .628 | -1.182 | 3.737 | |
| Reflection with Feedback | Comparison | -3.564* | 0.999 | .002 | -5.993 | -1.135 |
| Reflection | -1.277 | 1.012 | .628 | -3.737 | 1.182 | |
| Based on observed means.
The mean difference is significant at the .05 level. |
||||||
Effect Sizes
To synthesize the results and look for trends in the data within and across all three studies the investigator calculated effect sizes. Pretest to posttest effect sizes showed which group had higher initial gains (see Table 9). These effects were also pooled as weighted mean effect sizes to compare overall results.
Table 9: Pretest to Posttest Effect Sizes in d
| Condition | Spring 2018 | Autumn 2018 | Winter 2019 | Weighted Mean |
| Comparison | .94 | .89 | 1.57 | 1.15 |
| Reflection | 1.46 | .72 | 1.61 | 1.29 |
| Reflection with Feedback | 1.62 | 1.11 | 1.75 | 1.52 |
Pretest to retention test effect sizes show which group better retained these gains (see Table 10). These effects were also pooled as weighted mean effect sizes to compare overall results.
Table 10: Pretest to Retention Test Effect Sizes in d
| Condition | Spring 2018 | Autumn 2018 | Winter 2019 | Weighted Mean |
| Comparison | 1.35 | 1.31 | 2.24 | 1.66 |
| Reflection | 2.42 | 1.01 | 1.58 | 1.69 |
| Reflection with Feedback | 1.55 | 1.62 | 2.14 | 1.79 |
Summary of Results
Although the data did show deviations from normality in each study, a trend emerged. Students generally performed poorly on the pretest resulting in positive skewness and kurtosis in the pretest scores. After learning the material most groups made large gains and these were now grouped on the other end of the curve, as evidenced by both negative skewness and positive kurtosis in the posttest, and retention test.
Because this trend was most likely a reflection of accurate data and not due to error, the investigator did not attempt to transform the data. Additionally, these deviations from normalcy were not extreme. Mauchly’s test revealed that in two cases the assumption of Sphericity was not violated, the one time it was, the Greenhouse-Geisser values were interpreted.
In the Spring 2018 study, repeated measures ANOVA revealed a statistically significant within-subject interaction effect between condition and time of test. However, in this case and in the Autumn 2018 study, a Bonferroni adjustment revealed score differences between groups were not statistically significant at the p < .05 level. In the Winter 2019 study there was a statistically significant between-subject effect based on condition (F(2, 109) = 7.21, p < .001). A Bonferroni adjustment revealed group score differences between the comparison group and the reflection group were statistically significant (p = .03). Score differences between the comparison group and the reflection with feedback group were also statistically significant (p = .002).
In addition to tests of statistical significance, the investigator calculated effect sizes pretest to posttest and pretest to retention test for each study using Cohen’s d. Effects by condition were also combined as weighted mean effects to compare overall results. These weighted mean effects favored the reflection with feedback group, followed by the reflection only group, for both pretest to posttest and pretest to retention test.
Discussion
During the Spring 2018 study, as suggested by the literature, the reflection with feedback group made the greatest gains pretest to posttest. The reflection group also outperformed the comparison group, starting lowest overall and then surpassing the reflection with feedback group on the retention test. The reflection with feedback group plateaued between posttest and retention test. Engaging in reflection may have caused this group to maximize gains early in the study and achieve their full potential by the posttest. The other two groups, possibly due to continued use of the academic language related to perspective drawing in later units that built on the first unit, continued to learn to apply the academic language, explaining the unusual increase between posttest and retention test.
In the Autumn 2018 study, the comparison group unexpectedly made the greatest gains post to retention test, almost surpassing the reflection with feedback group in mean score on the retention test. This sample suffered from a high attrition rate of 36 subjects compared to 16 and 19 from Spring and Winter respectively. At the time of this study, students reported high rates of illness. This might have partially accounted for the high absence-based attrition as well as the slight decrease in learning in general seen in this study compared to the other two as evidenced by effect sizes both post and retention (see Tables 9 and 10).
In the Winter 2019 study, based on effect sizes (see Tables 9 and 10), all conditions in this study made the greatest gains compared to any other conditions in previous studies with one exception. This could have been partially due to the investigator in the role of classroom teacher improving the delivery of lessons. Unexpectedly, the comparison group began and continued to outscore either intervention group throughout the study and scored the highest mean score on all tests. A possible reason for the relatively high performance of the comparison group was the addition of a reading intervention program at the middle school where the study took place, as discussed further in the limitations section.
Synthesis
To synthesize the results and look for trends in the data across all three studies the investigator calculated weighted mean effects. An effect size provided a way to express the practical significance of a study (Ellis, 2010). While scores from two of the three studies were not statistically significant based on condition, effect sizes favored the intervention overall to help students learn and apply the academic language of perspective drawing.
John Hattie (2012) cited anything over d = 0.40 as a worthwhile effect size for an academic intervention. The groups who engaged in reflection with feedback added an average (d = 0.37) to their initial scores and an average (d = 0.13) to their retention scores above the comparison groups. These findings were strengthened by comparable results in three similar studies. When an educational intervention can add these moderate effect sizes to the learning and retention for minimal cost, it is generally worth pursuing. However, as these calculations were based on quasi-experimental studies, other factors could have contributed to these results.
Limitations
This study had a number of limitations. Some were outside the investigator’s control; some were due to intentional choices. These limitations were listed to help the reader draw more accurate conclusions and to keep the results in perspective in relation to other settings.
Because this study was quasi-experimental, there was a major threat to internal validity. While the assignment of condition was random by group, the sample was not randomly selected, nor were individuals randomly assigned to groups, this meant differences between groups could be due to preexisting conditions and not the treatment (Gall et al., 2007). The pretest was an attempt to mitigate this threat to internal validity.
In addition, the comparison between five intact art classes composed of students of various ages and experience levels taught by one investigator in the role of classroom teacher, while not ideal for external validity, was the best available in this study. Using intact groups was common in studies involving public school students (Gall et al., 2007).
As noted earlier, this study relied on a teacher generated test. While Gall et al., (2007) noted the limitations of these instruments, no suitable standardized measure of the academic language related to perspective drawing was located for use in this study, so additional measures were undertaken to ensure the test was reliable. In the future, a standardized test might be developed to help the results of a similar study to have enhanced external validity.
Timing of and number of tests students take in a given day, as well as frequency and duration of breaks, affected assessment results (Sievertsen, Gino, & Piovesan, 2016). Use of intact classes meant that time of day was not considered in the current study. Nor were the number of other tests given that day, nor break information, because gathering this type of information was beyond the scope of this study. Future studies might examine these factors.
Intelligence was a confounding variable in studies of achievement and metacognition (Ohtani & Hisasaka, 2018). While Georghiades (2004b) was able to obtain general information on the students’ academic ability in his study by accessing archival information, this type of data was not available to the researcher and administering a general aptitude test was beyond the scope of the current study.
The need for academic data was underscored during the Winter 2019 study. As previously noted, a possible reason for the relatively high performance of the comparison group as seen in effect sizes (see Tables 9 and 10) was the addition of a reading intervention program at the middle school where the study took place which caused discrepancies between groups that were not present in the first two studies. Two new reading intervention classes were formed at the start of the term, just prior to the Winter 2019 study. Scores from a standardized reading test were used to identify students who would benefit from a reading intervention, these students were then placed with a language arts teacher who would provide targeted interventions. This schedule change had the effect of grouping struggling readers together to attend the reading intervention.
By default, these same students would potentially attend elective classes together as a group. While this possibility was not formally evaluated due to the reading scores being unavailable for analysis at the time of the study, there was data to suggest this grouping took place. This included number of students served by an Individual Education Program (IEP) or 504 plan, and number of students identified as English Language Learners (ELL) (see Table 11).
Table 11:Characteristics of Winter 2019 Sample
| Students | |||||
| Served by | Identified as | ||||
| Condition | N | IEP or 504 plans | ELL | ||
| Comparison | 45 | 5 | 4 | ||
| Reflection | 42 | 8 | 14 | ||
| Reflection with Feedback | 25 | suppressed | suppressed | ||
In general, students served by IEPs for a specific learning disability experienced greater difficulty in reading than their peers who were not served by IEP plans (Corcoran & Chard, 2019). Students identified as ELL also had greater difficulty comprehending what they read in English than their peers who were not identified as ELL (Praveen & Rajan, 2013). Because reading was a major part of learning and retaining academic language this suggested that the reflection group had the most challenges in learning and retaining academic language. This was one explanation for the lower gains this group made from posttest to retention test (see Figure 3). The inability to conclusively analyze the covariate of reading ability was a limitation of the study.
The current study was based on nine reflective sessions over ten days. Georghiades (2004b) implemented between 20 to 30 reflective sessions, this length and frequency may be required for a long-term benefit gained by using metacognitive strategies. In studies where a significant effect was detected, the interval was often longer than two weeks (e.g. Rabin, & Nutter-Upham, 2010).
During the 2017-18 school year, the Washington State Unexcused Absence Rate was 0.80% (OSPI, 2017). The District in which the study took place had an Unexcused Absence Rate for the same year of 0.69%, while the Unexcused Absence Rate at school in which the study took place was 1.81%, almost three times the district average. Absence caused 16 students to be dropped from the Spring 2018 study, 36 from the Autumn 2018 study and 12 from the Winter 2019 study. These dropped students represented 13.5%, 27.7%, and 25.0% respectively of each total enrollment for the investigator in the role of classroom teacher.
Low attendance at school could have many causes, but anxiety was certainly a contributing factor (Ingul & Nordahl, 2013). Weight’s (2017) study provided evidence that teachers and their students benefit from MR. The chronically absent students who were dropped from the current study may have been the ones who would have benefited most from the perceived environmental improvements of MR (Black & Wiliam, 2009).
Bianchi (2007) noted the possible differential effect of teachers reacting to student reflections as a weakness in earlier studies. If one group benefited from improved instruction based on their expressed needs and another did not, this could confound interpretation of results. To avoid the investigator in the role of classroom teacher adjusted instruction for all classes based on feedback received from the reflection groups. This may have inflated the comparison group scores, possibly obscuring some of the effects of the intervention.
A conducive classroom environment for reflection (Black, & Wiliam, 2009) included student trust of the teacher (Georghiades, 2004a; Hattie & Clarke, 2019), the current studies were conducted in the context of a semester length class, at times, towards the beginning of the term. There may have been insufficient time for students to develop trust of the investigator in the role of classroom teacher. Additionally, students must have been free from fear of judgment from other students or the instructor (Slinger-Friedman & Patterson, 2016). Perhaps the manner in which the instructor provided feedback was not optimal. An anonymous method, while less responsive, may have promoted greater feelings of student security.
Further Research
While research on metacognition was broad and well developed, some specific applications had not been fully studied, and not all studies were as rigorously conducted.
Bannert and Mengelkamp (2008) called for improved measures of metacognition. They hypothesized that while questionnaires measure quantity, and think aloud methods measure quality, both have their limitations. Other researchers (e.g. Dent & Koenka, 2016; McCardle & Hadwin, 2015, Ohtani & Hisasaka, 2018; and Schellings & Van Hout-Wolters, 2011) have made similar observations and noted the need for further research in this area.
There were multiple reports of teachers valuing metacognitive strategies, but not spending much time promoting them (e.g. Bannister-Tyrrell & Clary, 2017; Dignath & Büttner, 2018). Studies which ask the types of questions Bannister-Tyrrell and Clary (2017) posed to more teachers to see if the reasons for this disconnect can be understood and addressed, are called for.
Studies such as the current one, provided evidence of the short-term benefits of MR. There is reason to believe that metacognition has long-term effects as well (Georghiades, 2004a). This will require longitudinal studies of the type called for by Dignath and Büttner (2008) and Panadero (2017).
The link between feedback and improved academic outcomes has been studied in depth (e.g. Hattie & Clarke, 2019; Hattie & Timperley, 2007; Schunk, Pintrich, & Meece, 2008), but some areas, including the best timing of the delivery of the feedback are still being researched (Shute, 2008). Baliram and Ellis (2019) called for additional study in this area.
Conclusion
The empirical evidence provided by this study should be interpreted with some caution based on aforementioned limitations. A strength of this study was that it did not rely on self-report which was often the case in these types of study (Dinsmore et al., 2008). Also, because it was conducted in a school classroom, it had a certain “real world” authenticity. Thus, the study avoided Zimmerman’s (2011) criticism that many of these types of studies have been done outside the classroom context and after the fact.
Metacognition reflection is a not magic solution to every problem in education. Ellis and Bond (2016) cautioned that many educational innovations, even those with sound theoretical foundations are subject to failure when attempted in the classroom. They also reminded us that using numbers as the sole basis for judging the effectiveness of an intervention in a democratic society, while getting at the academic side of things, runs the risk of overlooking other beneficial aspects of school life such as social interaction (Ellis & Bond, 2016).
References
- Baliram, N., & Ellis, A. K. (2019). The impact of metacognitive practice and teacher feedback on academic achievement in mathematics. In School Science & Mathematics, 119(2), pp. 94-104. URL: doi:10.1111/ssm.12317
- Bannert, M., & Mengelkamp, C. (2008). Assessment of metacognitive skills by means of instruction to think aloud and reflect when prompted. Does the verbalisation method affect learning?In Metacognition & Learning, 3(1), pp. 39-58. URL: doi:10.1007/s11409-007-9009-6
- Bannister-Tyrrell, M., & Clary, D. (2017). Metacognition in the English classroom: Reflections of middle years teachers navigating the Australian curriculum: English. In English in Australia (0155-2147), 52(3), pp. 63–72.
- Bianchi, G. A. (2007). Effects of metacognitive instruction on the academic achievement of students in the secondary sciences (Unpublished doctoral dissertation). Seattle Pacific University, Seattle, Washington.
- Black, P., & Wiliam, D. (2009). Developing the theory of formative assessment. In Educational Assessment, Evaluation & Accountability, 21(1), pp. 5-31. doi:10.1007/s11092-008-9068-5
- Bond, J. B., Denton, D. W., & Ellis, A. K. (2015). Impact of reflective assessment on student learning: Best-evidence synthesis from ten quantitative studies. In International Dialogues on Education: Past and Present, Vol. 2, Nr. 2.URL: www.ide-journal.org/wp-content/uploads/2015/09/IDE-2015-2-full.pdf ), pp. 172-184.
- Borenstein, M., Hedges, L. V., Higgins, J., & Rothstein, H. R. (2009). Introduction to meta-analysis. Chichester, UK: John Wiley & Sons Ltd.
- Brown, A. L. (1994). The advancement of learning. In Educational Researcher, 23(8), 4-12. URL: doi:10.2307/1176856
- Burnard, P., & Hennessy, S. (2006). Reflective practices in arts education. Dordrecht: Springer.
- Corcoran, M., & Chard, D. J. (2019). The state of learning disabilities: Identifying struggling students. [PDF file] URL: www.ncld.org/the-state-of-learning-disabilities understanding-the-1-in-5 (retrieved: 2019, August 8)
- Dent, A., & Koenka, A. (2016). The relation between self-regulated learning and academic achievement across childhood and adolescence: A meta-analysis.In: Educational Psychology Review, 28(3), pp. 425-474. URL: doi:10.1007/s10648-015-9320-8
- Dignath, C., & Büttner, G. (2008). Components of fostering self-regulated learning among students. A meta-analysis on intervention studies at primary and secondary school level. In Metacognition & Learning, 3(3), pp. 231-264. URL: doi:10.1007/s11409-008-9029-x
- Dignath, C., & Büttner, G. (2018). Teachers’ direct and indirect promotion of self-regulated learning in primary and secondary school mathematics classes – insights from video-based classroom observations and teacher interviews. In Metacognition Learning Metacognition and Learning, 13(2), pp. 127-157.
- Dinsmore, D., Alexander, P., & Loughlin, S. (2008). Focusing the conceptual lens on metacognition, self-regulation, and self-regulated learning. In Educational Psychology Review, 20(4), pp. 391-409. URL: 10.1007/s10648-008-9083-6
- Ellis, P. D. (2010). The essential guide to effect sizes: Statistical power, meta-analysis, and the interpretation of search results. Cambridge: Cambridge University Press.
- Ellis, A. K., & Bond, J.B. (2016). Research on educational innovations (5th ed.). New York, NY: Routledge.
- Ellis, A. K., & Denton, D. (2010). Teaching, learning & assessment together: Reflective assessments for middle & high school mathematics & science. Larchmont, NY: Eye on Education.
- Ellis, A. K., Denton, D. W., & Bond, J. B. (2014). An analysis of research on metacognitive teaching strategies. In Procedia – Social and Behavioral Sciences, 116, 4015-4024. URL: https://doi.org/10.1016/j.sbspro.2014.01.883
- Faul, F., Erdfelder, E., Lang, A.G., & Buchner, A. (2007). G*Power 3: A flexible statistical power analysis program for the social, behavioral, and biomedical sciences. In Behavior Research Methods, 39, pp. 175-191.
- Field, A. (2013). Discovering statistics using IBM SPSS statistics: And sex and drugs and rock ‘n’ roll. Los Angeles, Calif: Sage.
- Flavell, J. H. (1979). Metacognition and cognitive monitoring: A new area of cognitive developmental inquiry. In American Psychologist, 34(10), pp. 906-911. URL: http://dx.doi.org/10.1037/0003-066X.34.10.906
- Flavell, J. H. (1985). Cognitive development (2nd ed.). Englewood Cliffs, N.J.: Prentice-Hall.
- Flavell, J. H. (1999). Cognitive development: Children’s knowledge about the mind. Annual Review of Psychology, 50(1), pp. 21-45. URL: doi: 10.1146/annurev.psych.50.1.21
- Flavell, J. H. (2000). Development of children’s knowledge about the mental world. In International Journal of Behavioral Development, 24(1), pp. 15-23. URL: http://doi:10.1080/016502500383421
- Flavell, J.H., Green, F.L., & Flavell, E.R. (2000). Development of children’s awareness of their own thoughts. Journal of Cognition and Development, 1, pp. 97-112.
- Fox, E., & Riconscente, M. (2008). Metacognition and self-regulation in James, Piaget, and Vygotsky. In Educational Psychology Review, 20(4), pp. 373-389. URL: 10.1007/s10648-008-9079-2
- French, B., Sycamore, N. J., McGlashan, H. L., Blanchard, C. C. V., & Holmes, N. P. (2018). Ceiling effects in the Movement Assessment Battery for Children-2 (MABC-2) suggest that non-parametric scoring methods are required. In PLoS ONE, 13(5), pp. 1–22.
- Gall, M. D., Gall, J. P., & Borg, W. R. (2007). Educational research: An introduction. Boston: Pearson/Allyn & Bacon.
- Georghiades, P. (2004a). From the general to the situated: Three decades of metacognition. In International Journal of Science Education, 26(3), pp. 365-383. URL: http://doi:10.1080/0950069032000119401
- Georghiades, P. (2004b). Making pupils’ conceptions of electricity more durable by means of situated metacognition. International Journal of Science Education, 26(1), pp. 85–89.
- Hattie, J. (2012). Visible learning for teachers: Maximizing impact on learning. New York, NY: Routledge.
- Hattie, J., & Clarke, S. (2019). Visible learning: Feedback. Abingdon, Oxon: Routledge.
- Hattie, J., & Timperley, H. (2007). The power of feedback. Review of Educational Research, 77(1), pp. 81-112.
- Ho, A. D., & Yu, C. C. (2015). Descriptive statistics for modern test score distributions: Skewness, kurtosis, discreteness, and ceiling effects. In Educational and Psychological Measurement, 75(3), pp. 365-388. URL: doi:10.1177/0013164414548576
- Ingul, J. M., & Nordahl, H. M. (2013). Anxiety as a risk factor for school absenteeism: What differentiates anxious school attenders from non-attenders? Annals of general psychiatry, 12(1), p. 25. URL: doi:10.1186/1744-859X-12-25
- Jucks, R., & Paus, E. (2012). What makes a word difficult? Insights into the mental representation of technical terms.In Metacognition & Learning, 7(2), pp. 91–111.
- Kwon, K., & Jonassen, D. H. (2011). The influence of reflective self-explanations on problem-solving performance. In Journal of Educational Computing Research, 44(3), pp. 247-263.
- Lahey, T. (2017). Collaborating to address the challenge of academic language. Journal of Teacher Education, 68(3), pp. 239-250. URL: https://doi.org/10.1177/0022487117696279
- Lakens, D. (2013). Calculating and reporting effect sizes to facilitate cumulative science: a practical primer for t-tests and ANOVAs. In Frontiers in psychology, 4, pp. 1-12. URL: https://doi.org/10.3389/fpsyg.2013.00863
- Lawrence, J. F., Crosson, A. C., Paré-Blagoev, E. J., & Snow, C. E. (2015). Word generation randomized trial: Discussion mediates the impact of program treatment on academic word learning. In American Educational Research Journal, 52(4), pp.750-786. URL: doi:10.3102/0002831215579485
- Little, E. (1960). Pre-test and re-test scores in retention calculation. In The Journal of Experimental Education, 29(2), pp. 161-167.
- MacSwan, J. (2018). Academic English as standard language ideology: A renewed research agenda for asset-based language education. In Language Teaching Research, 00(0), pp. 1-9. URL: doi:10.1177/1362168818777540
- Maryland State Department of Education. (2018). Student self-reflection in assessment tasks. The Maryland State Department of Education.
- McCardle, L., & Hadwin, A. (2015). Using multiple, contextualized data sources to measure learners’ perceptions of their self-regulated learning. In Metacognition & Learning, 10(1), pp. 43-75. URL: doi:10.1007/s11409-014-9132-0
- McFarland, J., Hussar, B., Wang, X., Zhang, J., Wang, K., Rathbun, A., . . . Mann, F. B. (2018). In The condition of education 2018, (NCES 2018-144). U.S. Department of Education. Washington, DC: National Center for Education Statistics.
- Montague, J. (2013). Basic perspective drawing: A visual approach (6th ed.). Hoboken, New Jersey: Wiley.
- Nagy, W., Townsend, D., Lesaux, N., & Schmitt, N. (2012). Words as tools: Learning academic vocabulary as language acquisition. In Reading Research Quarterly, 47(1), pp. 91-108.
- NationalCoalition for Core Arts Standards. (2014). National core arts standards. Dover, DE: State Education Agency Directors of Arts Education.
- Ohtani K., & Hisasaka T. (2018). Beyond intelligence: A meta-analytic review of the relationship among metacognition, intelligence, and academic performance. Metacognition and Learning, 13(2), pp. 179-212.
- Panadero, E. (2017). A review of self-regulated learning: Six models and four directions for research. Frontiers in Psychology, 8(422), pp. 1-28. URL: http://doi.org/10.3389/fpsyg.2017.00422
- Pennisi, A. C. (2013). Negotiating to engagement: Creating an art curriculum with eighth-graders. In Studies in Art Education, 54(2), pp. 127–140.
- Praveen, S. D., & Rajan, P. (2013). Using graphic organizers to improve reading comprehension skills for the middle school ESL students. In English Language Teaching, 6, 2, pp. 155-170.
- Proust, J. (2007). Metacognition and metarepresentation: Is a self-directed theory of mind a precondition for metacognition? In Synthese, 159 (2), pp. 271-295. URL: doi:10.1007/sl 1229-007-9208-3
- Rabin, L. A., & Nutter-Upham, K. E. (2010). Introduction of a journal excerpt activity improves undergraduate students’ performance in statistics. In College Teaching, 58(4), pp. 156–160.
- San Diego Unified School District. (2018). Visual art- written reflection / assessment. San Diego Unified School District.
- Schellings, G., & Van Hout-Wolters, B. (2011). Measuring strategy use with self-report instruments: Theoretical and empirical considerations. Metacognition and Learning, 6(2), pp. 83–90. URL: doi:10.1007/s11409-011-9081-9
- Schunk, D. H., Pintrich, P. R., & Meece, J. L. (2008). Motivation in education: Theory, research, and applications. Upper Saddle River, N.J.: Merrill.
- Sievertsen, H. H., Gino, F., & Piovesan, M. (2016). Cognitive fatigue in school. Proceedings of the National Academy of Sciences, 113(10), pp. 2621-2624. URL: doi: https://doi.org/10.1073/pnas.1516947113
- Slinger-Friedman, V., & Patterson, L. M. (2016). Using online journals and in-class note cards for reflective and responsive teaching and learning. In College Teaching, 64(1), pp. 38–39.
- Tabachnick, B. G., & Fidell, L. S. (2007). Using multivariate statistics (5th ed.). Boston, MA.: Allyn & Bacon/Pearson Education.
- Tarricone, P. (2011). The taxonomy of metacognition. New York, NY: Psychology Press Taylor and Francis Group.
- Uccelli, P., Galloway, E. P., Barr, C. D., Meneses, A., & Dobbs, C. L. (2015). Beyond vocabulary: Exploring cross-disciplinary academic-language proficiency and its association with reading comprehension. In Reading Research Quarterly, 50(3), pp. 337-356.
- Vogt, W. P., & Johnson, B. (2011). Dictionary of statistics & methodology: A nontechnical guide for the social sciences. Thousand Oaks, Calif: SAGE.
- Weight, K. (2017). Metacognition as a mental health support strategy for elementary students with anxiety (Unpublished doctoral dissertation). Seattle Pacific University, Seattle, WA.
- Wellman, H. M., Ritter, K., & Flavell, J. H. (1975). Deliberate memory behavior in the delayed reactions of very young children. In Developmental Psychology, 11(6), pp. 780-787. URL: http://dx.doi.org/10.1037/0012-1649.11.6.780
- Winner, E. &, Simmons, S. (1992). Arts PROPEL handbook series. Cambridge, MA: Educational Testing Service and the President and Fellows of Harvard College
- Wismath, S., Orr, D., & Good, B. (2014). Metacognition: Student reflections on problem solving. Journal on Excellence in College Teaching, 25(2), pp. 69-90.
- Zimmerman, B. J. (2011). Motivational sources and outcomes of self-regulated learning and performance. In Zimmerman, B.J., & H. Schunk, D. (Eds.), Handbook of self-regulation of learning and performance. New York, NY: Routledge, pp. 49-64
- Zimmerman, B. J. (2013). From cognitive modeling to self-regulation: A social cognitive career path. In Educational Psychologist, 48(3), pp. 135-147. URL: doi:10.1080/00461520.2013.79 4676
- Zuckerman, G. (2003). The learning activity in the first years of schooling: The developmental path toward reflection. In A. Kozulin, B. Gindis, V. S. Ageyev, & S. M. Miller (Eds.), Vygotsky’s educational theory in cultural context (1st ed.). Cambridge, UK: Cambridge University Press, pp. 177-199. URL: doi:10.1017/CBO9780511840975
About the Author
Dr. Eric E. Howe: Adjunct Professor, College of Education, Seattle Pacific University, USA; e-mail: ehowe@spu.edu